Contents
Financial Highlights
Revenue
HK$
XX,XXX
m
Core operating profit
HK$
XX,XXX
m
Basic EPS
HK$
0.XX
FY2018: HK$
0.41
Dividend per share for the year
HK$
X.XX
Including special dividend per share
HK$
X.XX
Corporate Strategies
Multi-brand Strategy




CTF ‧ HUÁ Collection
As at 31 March 2019
XXX POS
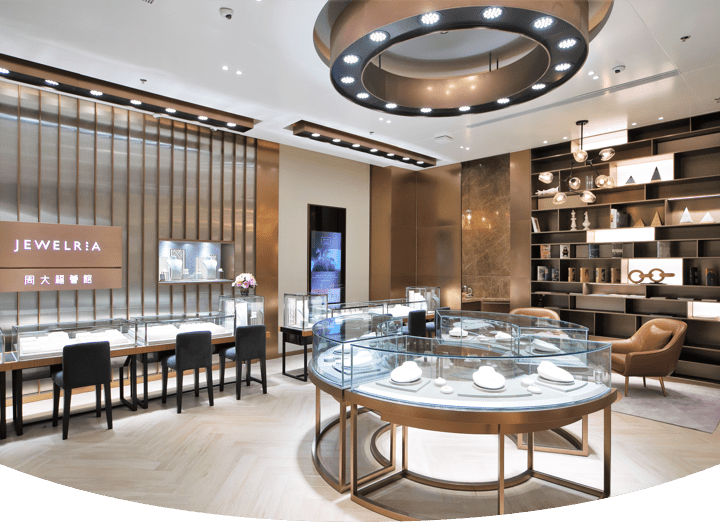

As at 31 March 2019
XXX POS


First ARTRIUM showroom opened in Hong Kong
Fantastical Creatures Collection
As at 31 March 2019
XXX POS


As at 31 March 2019
POS
XXX CIS
Mainland China
RSV growth
XXX%
of diamond
product RSV
product RSV
XX.X%
Hong Kong and Macau
RSV growth
XXX%
of diamond
product RSV
product RSV
XX.X%
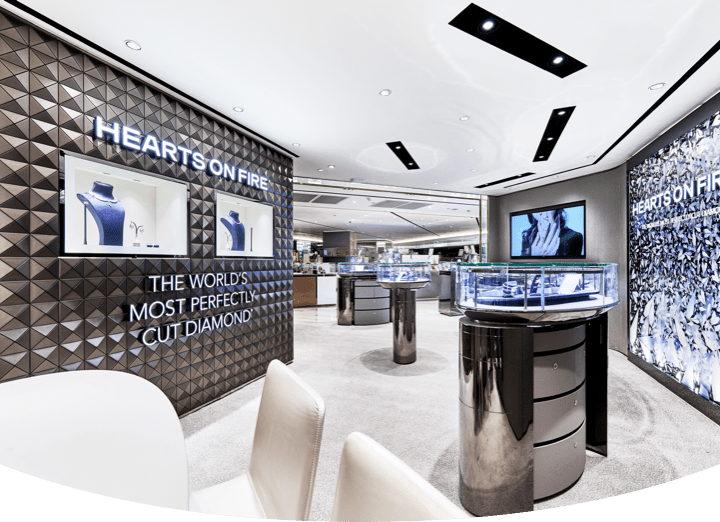
As at 31 March 2019
XXX POS
XXX SIS and CIS

As at 31 March 2019
XXX POS

As at 31 March 2019
XXX POS
Corporate Strategies
Customisation
D-ONE jewellery customisation platform


C2M experience centre in Shenzhen
POS Network
As at 31 March 2019
Mainland China
2,682
Hong Kong
80
Macau
19
Other markets
40

E-commerce of Mainland China

RSV

Contribution
to respective
to respective
RSV
X.X%
Retail sales
volume
volume
XX.X%

Unique daily
visitors
visitors
XXX,000

Average
selling price
selling price
HK$
X,XXX
Customer Relationship Management


Mainland
China
China
2,200,000
XX.X%
Hong Kong and
Macau
Macau
XXX,000
XX.X%
a % of RSV
Revenue
By reportable segment (HK$ m)

39.5%
60.5%
51,246

37.8%
62.2%
59,156

36.3%
63.7%
66,661

FY2019
XX.X% YoY

By product (HK$ m)(Excluding jewellery trading and service income from franchisees)

5.7%
11.5%
57.4%
25.3%
50,821

6.0%
10.9%
59.4%
23.7%
57,892

5.5%
10.6%
61.1%
22.8%
65,966

FY2019
XX.X% YoY

SSSG - Major Markets

FY2019
Mainland China
XX.X%
YoY
Hong Kong and Macau
XX.X%
YoY


11.4%
9.0%
5.0%
6.8%
3.8%
5.7%
-7.4%
0.7%
5.4%
13.0%
5.2%
17.4%
26.0%
23.0%
-6.0%
9.1%

SSSG - Major Products
Mainland China


3.3%
-1.4%
-1.4%
-7.7%
-3.8%
1.0%
-5.4%
0.1%
16.1%
14.8%
8.1%
13.6%
10.8%
11.1%
-11.0%
13.5%
Hong Kong and Macau


-4.4%
7.4%
22.2%
15.6%
26.4%
-2.3%
-8.2%
-10.4%
8.5%
20.6%
-0.9%
17.8%
30.9%
40.7%
-5.6%
2.6%

Core Operating Profit
By reportable segment (HK$ m)
FY2019
Mainland
China
China
XX.X%
YoY
Hong Kong, Macau
and other markets
and other markets
XX.X%
YoY


3,575
1,074

4,267
1,339

5,004
1,968


Profitability
Mainland China


29.7%
28.7%
28.8%
18.9%
17.9%
17.6%
11.5%
11.6%
11.8%
Hong Kong, Macau and other markets


26.7%
24.8%
26.3%
22.0%
19.3%
18.7%
5.3%
6.0%
8.1%

SG&A
(HK$ m)


20.1%
18.5%
18.0%

10,307
3.8%
1.5%
0.9%
3.6%
3.3%
6.9%

10,920
3.7%
1.4%
0.9%
2.7%
3.2%
6.7%

12,025
3.6%
1.3%
1.1%
2.3%
2.9%
6.9%
FY2019
XX.X%
YoY

Capital and Cash Flows Management
Net gearing ratio
40.1%
Hedging ratio
XX%
Free cash flows
HK$
XX
m
Capex
HK$
XXX
m


